


Why Creative Intelligence Matters for Modern Marketing Teams
Modern marketing teams have no shortage of creative and performance data. For many, that’s the problem. Creative teams know what was made. Media...
7 min read
Elena Koutsoukos
Oct 26, 2026, 5:07:50 AM
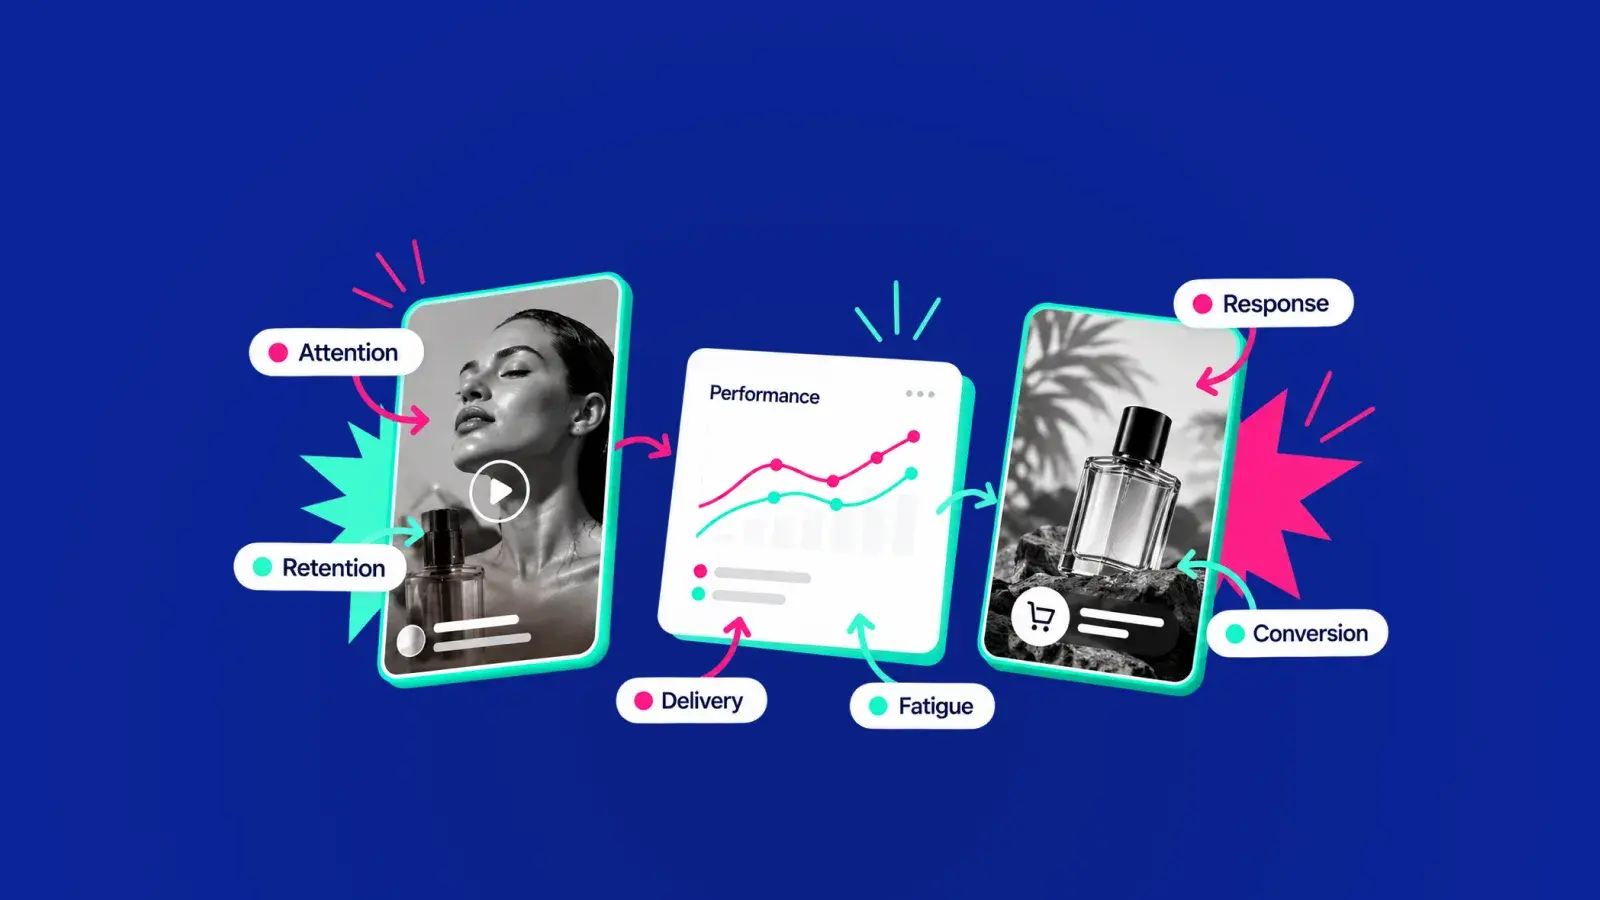
Creative performance data is everywhere. The harder part is knowing what each signal is telling you.
A rising click-through rate, falling completion rate, or increasing CPA points to a different part of the performance story. Read in isolation, those metrics leave important questions unanswered, but read together, they highlight where attention is won and where performance begins to falter.
This guide breaks down six creative performance signals marketers should watch, what each one can reveal, and what to investigate next.
Creative Performance Analytics is the process of measuring and comparing how advertising creative performs across signals such as attention, retention, response, conversion, efficiency, and changes over time.
It helps teams answer practical questions: Which creative is earning attention? Which is holding it? Which is driving action? And how does performance change across audiences, regions, platforms, and business outcomes?
Creative Performance Analytics sits between the Creative Data and the deeper Creative Performance Intelligence teams build from it, helping marketers measure and compare how creative performs across the signals that matter.
This article focuses on that analytical layer: the creative performance signals marketers should monitor, what each one can tell them, and how those signals can inform the next decision.
No single metric gives a complete view of creative performance. The best approach is to read each signal for what it can genuinely tell you, then use it to decide what deserves closer analysis.
We’ve broken these down into six priority signals.
Before creative can persuade, inform, or convert, it has to earn attention.
Attention signals show whether people are noticing the ad and engaging with its opening moments, especially in fast-moving video and social environments.
Signals to look at
What these signals can tell you
Low attention can leave teams questioning the concept as a whole, when the real issue may lie in the first impression. When attention improves, it is a sign that the opening is earning notice and giving people a reason to engage.
What they don’t prove
An ad can capture attention yet still lose interest immediately after. Early viewing shows the opening is doing its job, but it doesn’t tell you whether people stay engaged after those first moments.
What to investigate next
Look more closely at:
Practical takeaway
If early attention is low, test different opening approaches before changing the entire concept. The problem may sit in the first few seconds, and not in the idea itself.
Getting noticed is one thing, but keeping attention long enough for the message to land is another.
Retention is most directly measured in video and other time-based formats, where teams can see how long people stay engaged and where attention begins to drop. In carousels, Reels, Stories, or interactive formats, progression, swipe depth, and interaction depth provide a similar view of whether the creative is holding attention.
Signals to look at
What these signals can tell you
Retention data points to where interest begins to wane. A strong start followed by a sharp drop-off suggests the opening is working, but something later in the creative is causing viewers to drift away.
What they don’t prove
Someone might watch most of an ad without clicking or converting. Retention shows that the creative is holding attention, not whether that attention is producing the desired campaign outcome.
What to investigate next
Look more closely at:
Practical takeaway
Use retention signals to identify where attention starts to fall, then compare what happens at those points across stronger- and weaker-performing creative.
Response signals show whether the audience moves from viewing or engaging with the ad to taking action.
Signals to look at
What these signals can tell you
When response signals improve, the creative is doing more than attracting attention; it is giving people a clear reason to act. When they stall, the gap sits between interest and motivation, pointing teams toward the offer, proposition, CTA, or product relevance.
What they don’t prove
A click or tap doesn’t mean the campaign has achieved its business outcome.
Creative can generate a strong CTR while producing weaker conversion later in the journey. Response signals show that people took the next step, not whether that step ultimately led to a lead, purchase, or other desired outcome.
What to investigate next
Look more closely at:
Practical takeaway
If attention is healthy but response is lagging, focus testing on the proposition and action-driving elements rather than the opening alone.
Response metrics tell you that someone took the next step. Conversion signals show whether that step led to the business outcome the campaign was designed to drive.
Signals to look at
What these signals can tell you
A click-through rate that outpaces conversion suggests the creative is generating interest without carrying that momentum through to the intended outcome. The ads that convert most efficiently can then reveal which creative approaches are worth testing across new audiences, placements, or campaigns.
What they don’t prove
Conversion is influenced by more than creative alone.
Landing page experience, pricing, audience quality, product availability, media delivery, and other parts of the customer journey can all affect the final result. A change in conversion should not automatically be attributed to the creative without looking at the wider context.
What to investigate next
Look more closely at:
Practical takeaway
Use conversion signals to judge whether creative is contributing to the outcome the campaign actually cares about, then separate creative effects from wider journey or delivery factors before drawing a conclusion.
Creative almost never performs under identical media conditions. Efficiency and delivery signals help teams understand the environment in which an asset was evaluated.
Signals to look at
What these signals can tell you
These metrics show whether two assets were given a comparable opportunity to perform.
One creative might appear stronger because it received more favorable placements, reached a different audience mix, or was supported by a different level of spend. Frequency can also change how people respond as exposure increases.
What they don’t prove
Delivery metrics don’t tell you whether the creative itself is effective.
A lower CPM, greater reach, or higher spend can reflect media conditions rather than creative quality. These signals are most valuable when used to interpret other performance metrics, not as standalone evidence about what is working inside the ad.
What to investigate next
Look more closely at:
Practical takeaway
Before comparing two assets directly, check whether their delivery conditions are similar enough to make the comparison meaningful.
Creative performance can weaken as exposure increases, but fatigue won’t show up in a single metric.
Signals to look at
What these signals can tell you
A gradual decline across several metrics suggests that the creative is losing impact with the audience. That can happen when the same message, visual treatment, or execution has been exposed too frequently.
What they don’t prove
Declining performance doesn’t automatically mean the creative itself is fatigued.
Audience saturation, changes in placement mix, budget shifts, competitive conditions, or broader delivery changes can produce similar patterns.
What to investigate next
Look more closely at:
Practical takeaway
Treat fatigue as a pattern across multiple signals. If performance drops as exposure rises, compare creative and delivery conditions before deciding whether the asset needs to be refreshed, adapted, or replaced.
A strong result in one area can hide weakness somewhere else in the journey.
The combination of signals gives teams a better sense of what to investigate next.
| What you see | What it could suggest | What to investigate |
|---|---|---|
| Strong attention, weak retention | The creative earns the first moment but loses interest quickly | Pacing, sequencing, duration, message development |
| Strong retention, weak response | People stay engaged but have little reason to act | Value proposition, offer, CTA, product relevance |
| Strong response, weak conversion | The creative generates interest, but that interest is not translating into the intended outcome | Message expectation, audience fit, landing experience |
| Strong conversion, rising CPA | Creative may still be performing while media efficiency changes | Spend, frequency, audience saturation, placement mix |
| Performance declines as frequency rises | Possible creative fatigue or audience saturation | Creative age, exposure levels, audience-level performance |
These combinations should be treated as starting points for investigation. They are not conclusions! What they do is help teams narrow the question and decide where deeper analysis is most valuable.
Imagine an ad that earns plenty of early views, then loses viewers sharply around the six-second mark. Its click-through rate is healthy, but conversion is lagging.
That combination points to several different questions:
The next step isn’t to declare the ad a winner or loser. What’s more important is to investigate where the journey starts to break down. How is the pacing after the opening? When does the product or key benefit appear? Does the landing page deliver on the message or expectation created by the ad?
Looking at the signals together turns a collection of metrics into a much more useful creative question.
Vidmob’s Creative Analytics uses AI to analyze creative at scale, helping teams understand which strategies work best across audiences, regions, and platforms, then turn those learnings into better creative and media decisions.
That means teams don’t have to manually inspect every high- and low-performing asset to work out what differs.
Using the example above, teams could compare the creative attributes that appear across ads with better retention against those that lose viewers earlier. That could surface differences in pacing, product timing, message sequencing, branding, or visual treatment.
Creative Analytics can apply the same logic across each signal, connecting performance changes with the creative attributes most relevant to investigate:
So if an ad earns attention but loses viewers early, Creative Analytics can help teams move beyond spotting the drop-off to identifying which creative elements repeatedly appear in assets that hold attention for longer.
With Creative Analytics, teams can then:
Want to turn creative performance data into better marketing decisions? Book a demo.
Modern marketing teams have no shortage of creative and performance data. For many, that’s the problem. Creative teams know what was made. Media...
AI didn’t arrive in marketing fully formed and it certainly didn’t become agentic overnight. Despite how quickly new capabilities seem to emerge,...
Creative scale is becoming easier to achieve. The harder capability is learning from it fast enough. AI is making it faster to generate, adapt, and...