
4 min read

The Creative Testing Playbook: A Framework for Diagnosing and Scaling What Works

The Creative Testing Playbook: A Framework for Diagnosing and Scaling What Works
8:08

Most creative teams are already testing. The challenge is turning each test into guidance that compounds, diagnoses underperformance, and scales without adding headcount.

THE PROBLEM

Testing Isn’t the Problem. Scaling It Is.

Most creative teams are already testing. A/B a headline, run two versions of a hook, check which thumbnail gets more clicks. The instinct is there.

What usually breaks down is what happens after the test. Results sit in a slide from last quarter’s review, disconnected from the brief for next quarter’s campaign. A win on one platform doesn’t transfer to guidance for another. And when an asset underperforms, the diagnosis stops at “this one didn’t work” rather than identifying the specific element that caused it.


The result is a team that’s technically testing constantly but learning slowly. Every campaign starts closer to scratch than it should.

This playbook covers three things

1

A framework for testing that actually compounds instead of resetting each cycle.

2

A process for diagnosing why a specific asset underperformed instead of just noting that it did.

3

A way to keep both running as production volume goes up without adding headcount.

THE TESTING FRAMEWORK

Narrow the Scope Before You Score

The instinct with creative testing is to measure everything. That instinct produces a report nobody can act on. The fix is to narrow first — here’s the sequence.

1

Start wide.

Pull the full library of live and previously deployed creative, across every platform and campaign type you have data for. Include the losers, not just the winners. A model built only on top performers can’t tell you what to avoid.

2

Test everything against outcomes.

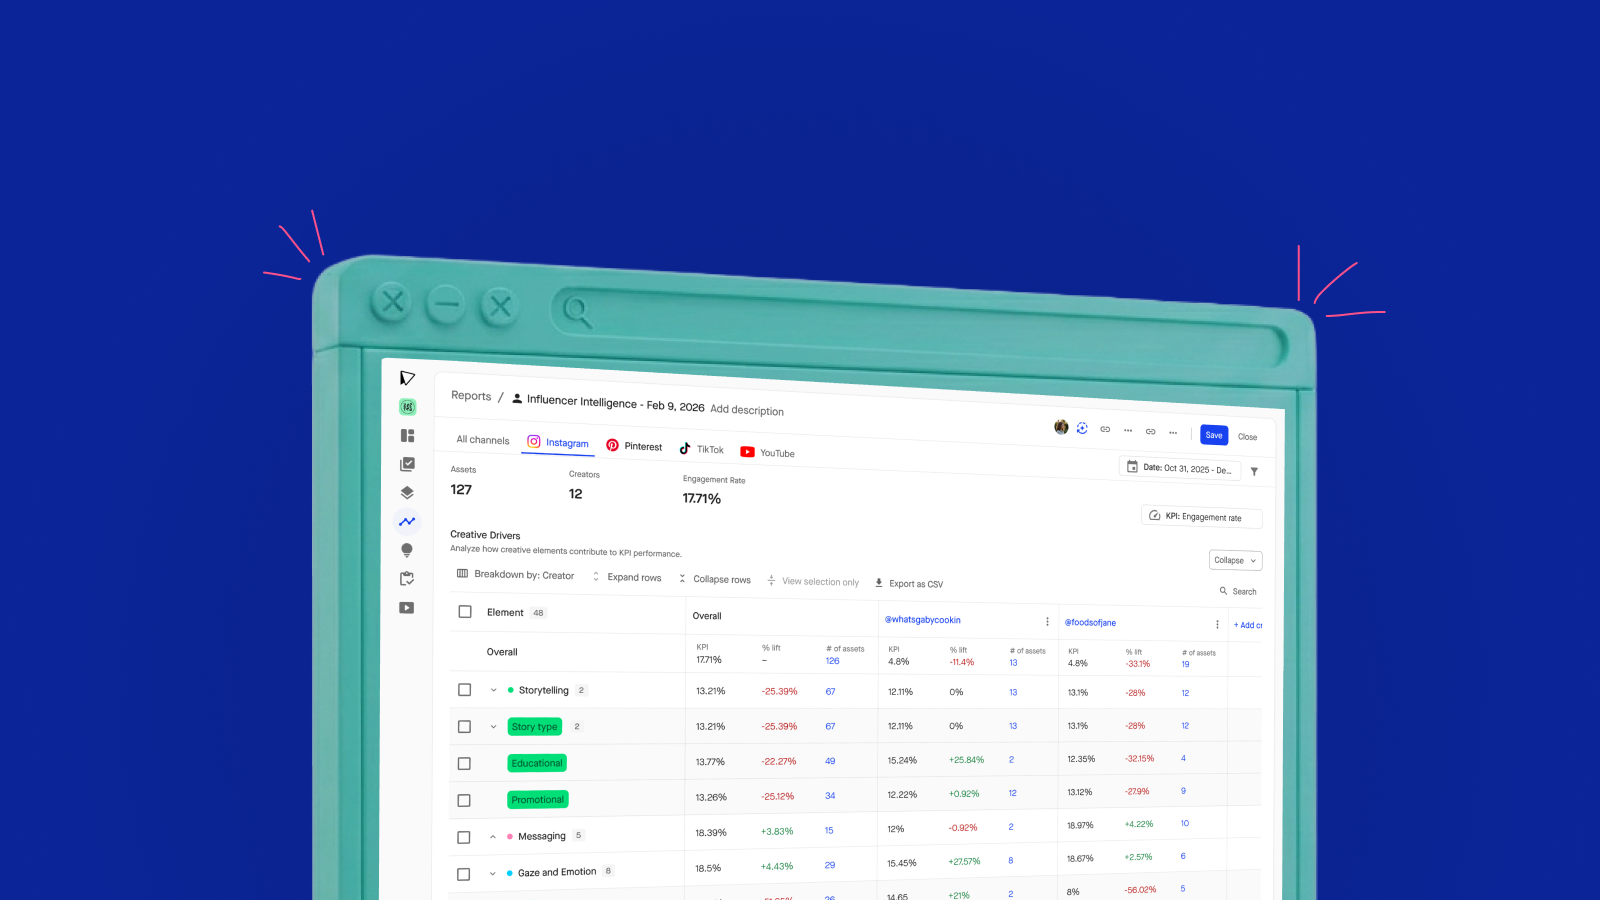
Run every visual and structural variable — tone, pacing, whether a human appears in the first three seconds, where the CTA sits, whether text is present and for how long — against the performance metric that matters most to you. Most of these variables won’t predict anything. That’s expected.

3

Narrow to what’s predictive.

In one recent case, a CPG enterprise ran this process across its library and narrowed thousands of possible creative variables down to 19 creative guidelines that were actually connected to outcomes.

Those 19 guidelines were 83% predictive of 3-second video view-through rate.

4

Score new creative against the narrowed list, before it runs.

Once the predictive guidelines are identified, they become a pre-flight check. A new asset gets scored against them before media dollars go behind it, not after the campaign ends.

5

Feed results back in.

Each review cycle should update the model. A variable that was predictive last quarter might not hold this quarter as the category shifts. Treat the 19 (or however many you land on) as a living guide, not a permanent one.

This loop is what separates ongoing testing from a testing program. The difference is whether each cycle makes the next one smarter.

DIAGNOSING UNDERPERFORMERS

When an Asset Underperforms, Check These Four Things

An underperformer usually gets pulled with no diagnosis, or guessed at based on gut feel. Neither produces guidance for the next brief. Run this sequence instead.

1

Find where viewers actually dropped off.

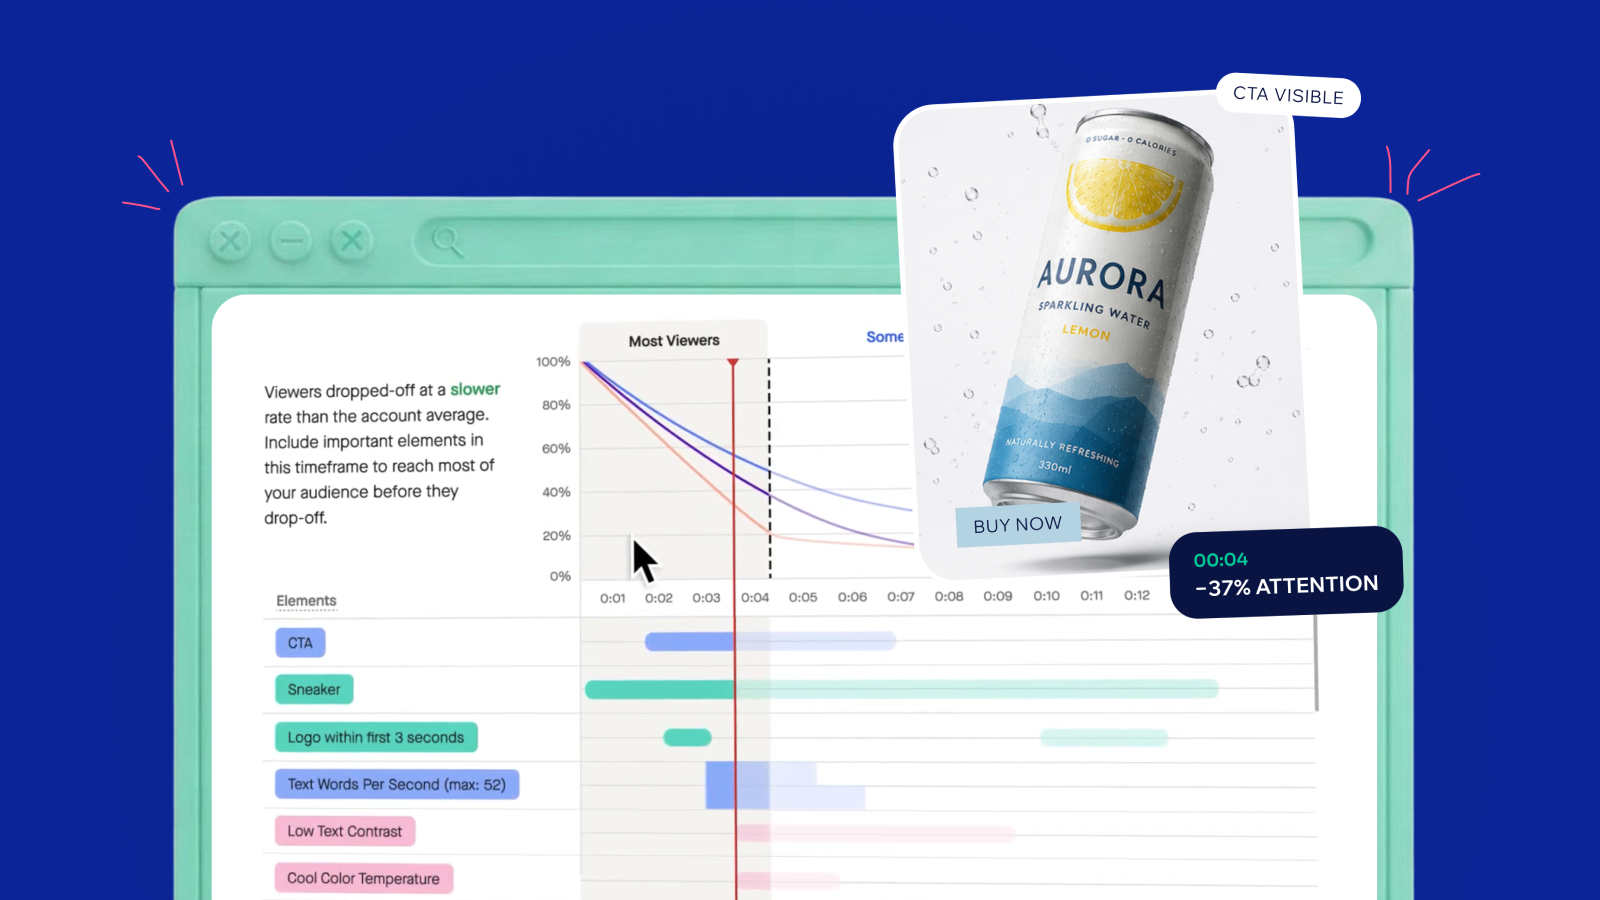
Pull the individual asset’s drop-off curve against the account average. If viewers are leaving faster than normal at a specific timestamp, that’s the starting point, not the whole video — one moment in it.

2

Check what was on screen at that moment.

Look at exactly which creative elements were visible when the drop-off accelerated: a logo that appeared too late, text that took up the frame, a CTA that showed up before any context. Specific, timestamped elements, not vague impressions.

3

Score the asset against your guidelines.

Run the underperforming asset through the same scoring model used for pre-flight checks. Note which specific criteria it failed, not just its overall score — an asset can score well overall and still fail one or two criteria that drive the underperformance.

4

Compare it to what’s actually winning.

Pull up the current leaderboard for the same platform and campaign type. What are the top performers doing differently on the criteria the underperformer failed? This turns a diagnosis into a brief, not a blank page.

Run through all four steps before tossing an asset into the trash. Most of the time, the reason is specific and fixable — a missing logo, a CTA that shows up two seconds too early, a hook that runs too long before the product appears.

SCALING PRODUCTION

More Variants, More Channels, Same Team

Every creative team is being asked for more: more platforms, more formats, more versions of the same core idea. Almost none of them are getting proportionally more people.

The instinct is to treat guidelines and production as two separate steps — build the creative, then send it for review against brand standards. That sequence doesn’t scale. Every added variant means another round trip between the creative team and whoever owns brand compliance.

The fix

Putting guidelines inside the tool where creative actually gets built. When scoring happens directly in the editing software, a creator sees whether an asset matches guidelines while it’s still in progress, not after it’s finished and submitted for review. That collapses what used to be a multi-round feedback cycle into a single pass.

Push the principle upstream

When creative insights and brand guidelines feed directly into the brief before production starts, the team building the asset isn’t guessing at what “on brand” means. Fewer surprises at review means fewer revisions — which is what actually lets a flat headcount keep pace with a growing number of channels and formats.

THE CONDENSED LOOP

Run This Every Campaign

A simple version of the loop, condensed into a cycle you can run on your next campaign.

1

Define guidelines.

Pull from brand standards, platform best practices, and your own historical performance data. Weight the guidelines your data shows actually predict better outcomes.

2

Score pre-flight.

Before any asset is in-flight, run it against the guideline set. Flag anything that fails a high-weighted criterion before spend goes behind it.

3

Run the campaign.

4

Diagnose underperformers.

Use the four-step sequence on anything that comes in below the account average.

5

Feed learnings back into guidelines.

Update the weighting before the next cycle starts. A criterion that mattered last quarter might not this quarter.

6

Repeat.

Each pass through the cycle should make the guideline set slightly sharper than the one before it.

PROOF THIS WORKS AT SCALE

Kellanova ran this exact loop across 10 brands and 443 assets over 13 months

100 to 10 hrs

Setup time dropped per brand — the tenfold drop that made running this across 10 brands possible.

10

Brands running the same loop, not a single pilot.

443

Assets scored across the full rollout.

What this changed


Setup time dropped from 100 hours to 10 hours per brand — the difference between a team manually writing scoring rules from scratch and a model narrowing thousands of variables down to the ones that matter.


Creative concept choice stopped being a debate of opinions in a room. Once the guideline set was built and scoring lived inside the production workflow, brief decisions started running on data the team could point to, not the loudest opinion in a creative review.

Neither of these required a bigger team. They required the testing loop to run somewhere the existing team already worked.

SEE HOW VIDMOB CAN HELP

Build this loop against your own creative library.

Vidmob’s team can walk through what the narrowing process looks like using your own brand’s existing performance data.

See the framework in action